Greetings. The Regular Season of the 2025 Men's Rugby Premiership concluded on Saturday. Black Pirates RFC ended the regular season as table leaders and the path to the Premiership goes through King's Park; they have to make it to the Grand Final to host it. As a continuation of the mid season report (an be accessed here), the end of Regular Season report has been compiled.
The Log
Halftime Log
Pirates, KOBs, Hippos, Heathens and Victoria Sharks are in the top 5 for both the log points and the halftime scores table. Heathens only trailed at halftime in one game, there Week 6 fixture against Jinja Hippos, which they went on to lose. Pirates only trailed at halftime in their Week 5 fixture against Heathens.
Scoring
The scoring in the regular seasons of 2024 and 2025 is compared against the first 11 weeks of play from 2023. The average points scored per game rose from 41.21 in 2024 to 51.27 in 2025. Try scoring, penalties and drop goals have all showed an increase from the 2024 numbers.
Tries and penalty tries combined account for 64.57% of the League points. All the playoff teams except for Buffaloes are above the League average in this category. Heathens and Hippos are the only two teams above 70% in this category; it could be due to the fact that the combined kickers of these two clubs have converted 59 of their 102 tries (57.8%). Heathens has elected to kick a penalty attempt at goal 14 times, successfully converting 7 (50%); no other team has made fewer than 20 penalty attempts at goal.
Tries Per Game
The same criteria used for the corresponding table in the Mid-Season report are applied here.
Pirates are the only club to score 3 or more tries in each of their games, and in 9 games they have scored 4 or more tries. The only teams that have failed to score a try in at least one game are Elgon Wolves (5), Warriors (4), Eagles (2) and Mongers (1).
Every club has at least one game in which they have conceded 4 or more tries, except KOBs; no team has managed to score 4 or more tries against them. Elgon Wolves has conceded 3 or more tries in their games, and in 10 games they have conceded 5 or more tries.
Try Scoring/Conceding Rate
The rate of try scoring/conceding is computed with reference to the number of games played (or duration of the game). 63 of the 66 games are fixed at 80 minutes, for simplicity. The remaining 3 games have actions recorded for post-80th minute game time; KOBs vs Pirates (Week 3), Pirates vs Eagles (Week 9) and Rhinos vs Buffaloes (Week 9).
There have been 435 tries scored up to Week 5, for a scoring rate of 1 try every 12 minutes and 9 seconds of a game.
Given their scoring rates, the top 4 teams are likely to score 2-3 tries in each half of game play. They are also taking longer to concede, with their ranges implying they can go an entire half without conceding a try. Elgon Wolves scoring rate implies they score 1 try every 2 games, and as such they have gone 5/11 games without scoring a try.
Four games days in 2025 recorded 40 or more tries, whereas the highest number of tries scored on a game day in 2024 was 37. No game day this season has recorded less than 30 tries. By comparison 5 game days in 2024 had less than 30 tries including the opening round which had only 16 tries scored.
Scoring Margins
The fulltime score margins for the different teams in the Premiership.
The regular season had three drawn games; Buffaloes 12 – 12 Walukuba (Week
3), Buffaloes 21 – 21 Victoria (Week 6) and Heathens 11 – 11 KOBs (Week 10).
Each team's winning and losing margin games are displayed below.
Only three teams have had multiple wins with a 31+ winning margin; Pirates (5), KOBs (3) and Heathens (3). Pirates have 8 wins with a 20+ margin. Rhinos are the only team to win a game by 31+ points (Week 6: 55-10 vs Elgon Wolves) and lose a game by 31+ points (Week 11: 10-49 vs Pirates).
Minutes in Lead
Time in lead explores what amount of duration in the game a team spent leading their opponent. It eliminates the time when the scores are level and only considers the game clock time when a team is ahead of the opponent.
Pirates have held the lead for 76% of their regular season playing time. They have held a 70% or better lead in 10 of their 11 games; for the Week 5 fixture against Heathens Pirates only led for 31 minutes (38.75%) compared to their opponents' lead of 39 minutes (48.75%) but still went on to win the game. Elgon Wolves have only managed leads in 2 games and for a combined 8 minutes of their regular season playing time.
Whereas the fulltime margin concentrates on the margin at the end of the game, time in lead looks at the course of the game and we can determine a team's biggest lead/deficit during a game. For instance, KOBs' biggest deficit is 16 points in their encounter against Pirates which they went on to win by a 2-point margin.
Pirates and KOBs are the only teams to win games with a deficit of more than 10 points; Pirates recovered from a 22-point deficit to win against Heathens whereas KOBs made a 16-point comeback to win against Pirates. Buffaloes and Victoria recovered from deficits of 12 (vs Walukuba) and 18 points (vs Buffaloes) respectively to draw their games.
Individual Points Scorers
217 different players scored points during the regular season. The embedded list availed below from Datawrapper makes it possible for one to search for a particular player or club of interest. The list is arranged according to clubs in alphabetical order, then within the clubs the arrangement lists the players according to points in descending order.
Corrections were made to the incorrect try assignment to William Nkore, which was reassigned to Jeremiah Okello, and another Arnold Manano try reassigned to Israel Makokha. The remaining pending issue concerns the number of tries scored by Andrew Odhiambo.
William Nkore continues to lead all points scorers on 141 points. Four other players reached the 100-point milestone in the regular season; Robin Odrua (Mongers, 123), Yasin Wasswa (Hippos, 113), Joseph Aredo (KOBs, 109) and Ivan Kirabo (Rhinos, 102).
Amongst try scorers, Michael Wokorach (Heathens), Jeremiah Okello (Pirates) and Joseph Oyet (Heathens) are tied on 8. Wokorach has played only 4 games, whereas Okello and Oyet have featured in 9 and 11 games respectively.
Try Per 80 is a computation of the number of tries scored per 80 minutes of play. TP80 is an indication for efficiency; higher values indicate a player requires less minutes of game time to score more tries (higher productivity). Due to the inconsistency in game day data collection, this has been limited to two qualifiers; (a) a player must have played at least 5 games during the regular season, and (b) a player must have scored at least 5 tries during the regular season.
The Try Per 80 for each player is then compared against their respective try per game measure, i.e., the number of tries the player scored per game played.
By applying the qualifiers (and making an exception for Wokorach; had only played 4 games), I was only left with 15 players to compare. Wokorach is the only player with both TPG and TP80 over 2.00. His TP80 of 2.45 implies that he would score more than 2 tries per 80 minutes of play; consistent with his 2 tries per game so far. The next closest player is Mark Omoding (TPG 1.00, TP80 1.11), who has featured in only 6 games this season. Jeremiah Okello has 1.12 TP80 (and a TPG of 0.89), the only other player with a TP80 over 1.00.
Goal Success Rate
Goal success rate has been computed for place kicks made in the 2025 regular season. A total of 48 players made 791 attempts at goal, with an overall success rate of 60.10%. The list is arranged according to club alphabetically, then within the club arrangement the player with the most attempts is listed first.
Joseph Aredo (KOBs) has the best goal success rate among all players with 20+ attempts at goal. The points attained per attempt was computed, to be compared with each kicker's goal success rate. This comparison only considered kickers who made at least 20 attempts at goal in the regular season; a total of 15 players. Players with high points per attempt are usually converting penalty goals with greater success compared to conversion. Hamza Kinyai has the highest points per attempt (1.89), he has only made 6 conversion attempt (50% success) compared to 21 penalty attempts (71.4% success).
Discipline and Officiation
The discipline statistics we have available cover the number of yellow cards, red cards and penalty tries conceded. There were 74 yellow cards issued during the regular season. The sole red card was shown to Gift Oketa of Mongers. Five penalty tries were awarded.
In Game Week 5 there were 11 players sent to the sinbin, more than any other game day. Each game had at least one player getting sent to the sinbin.
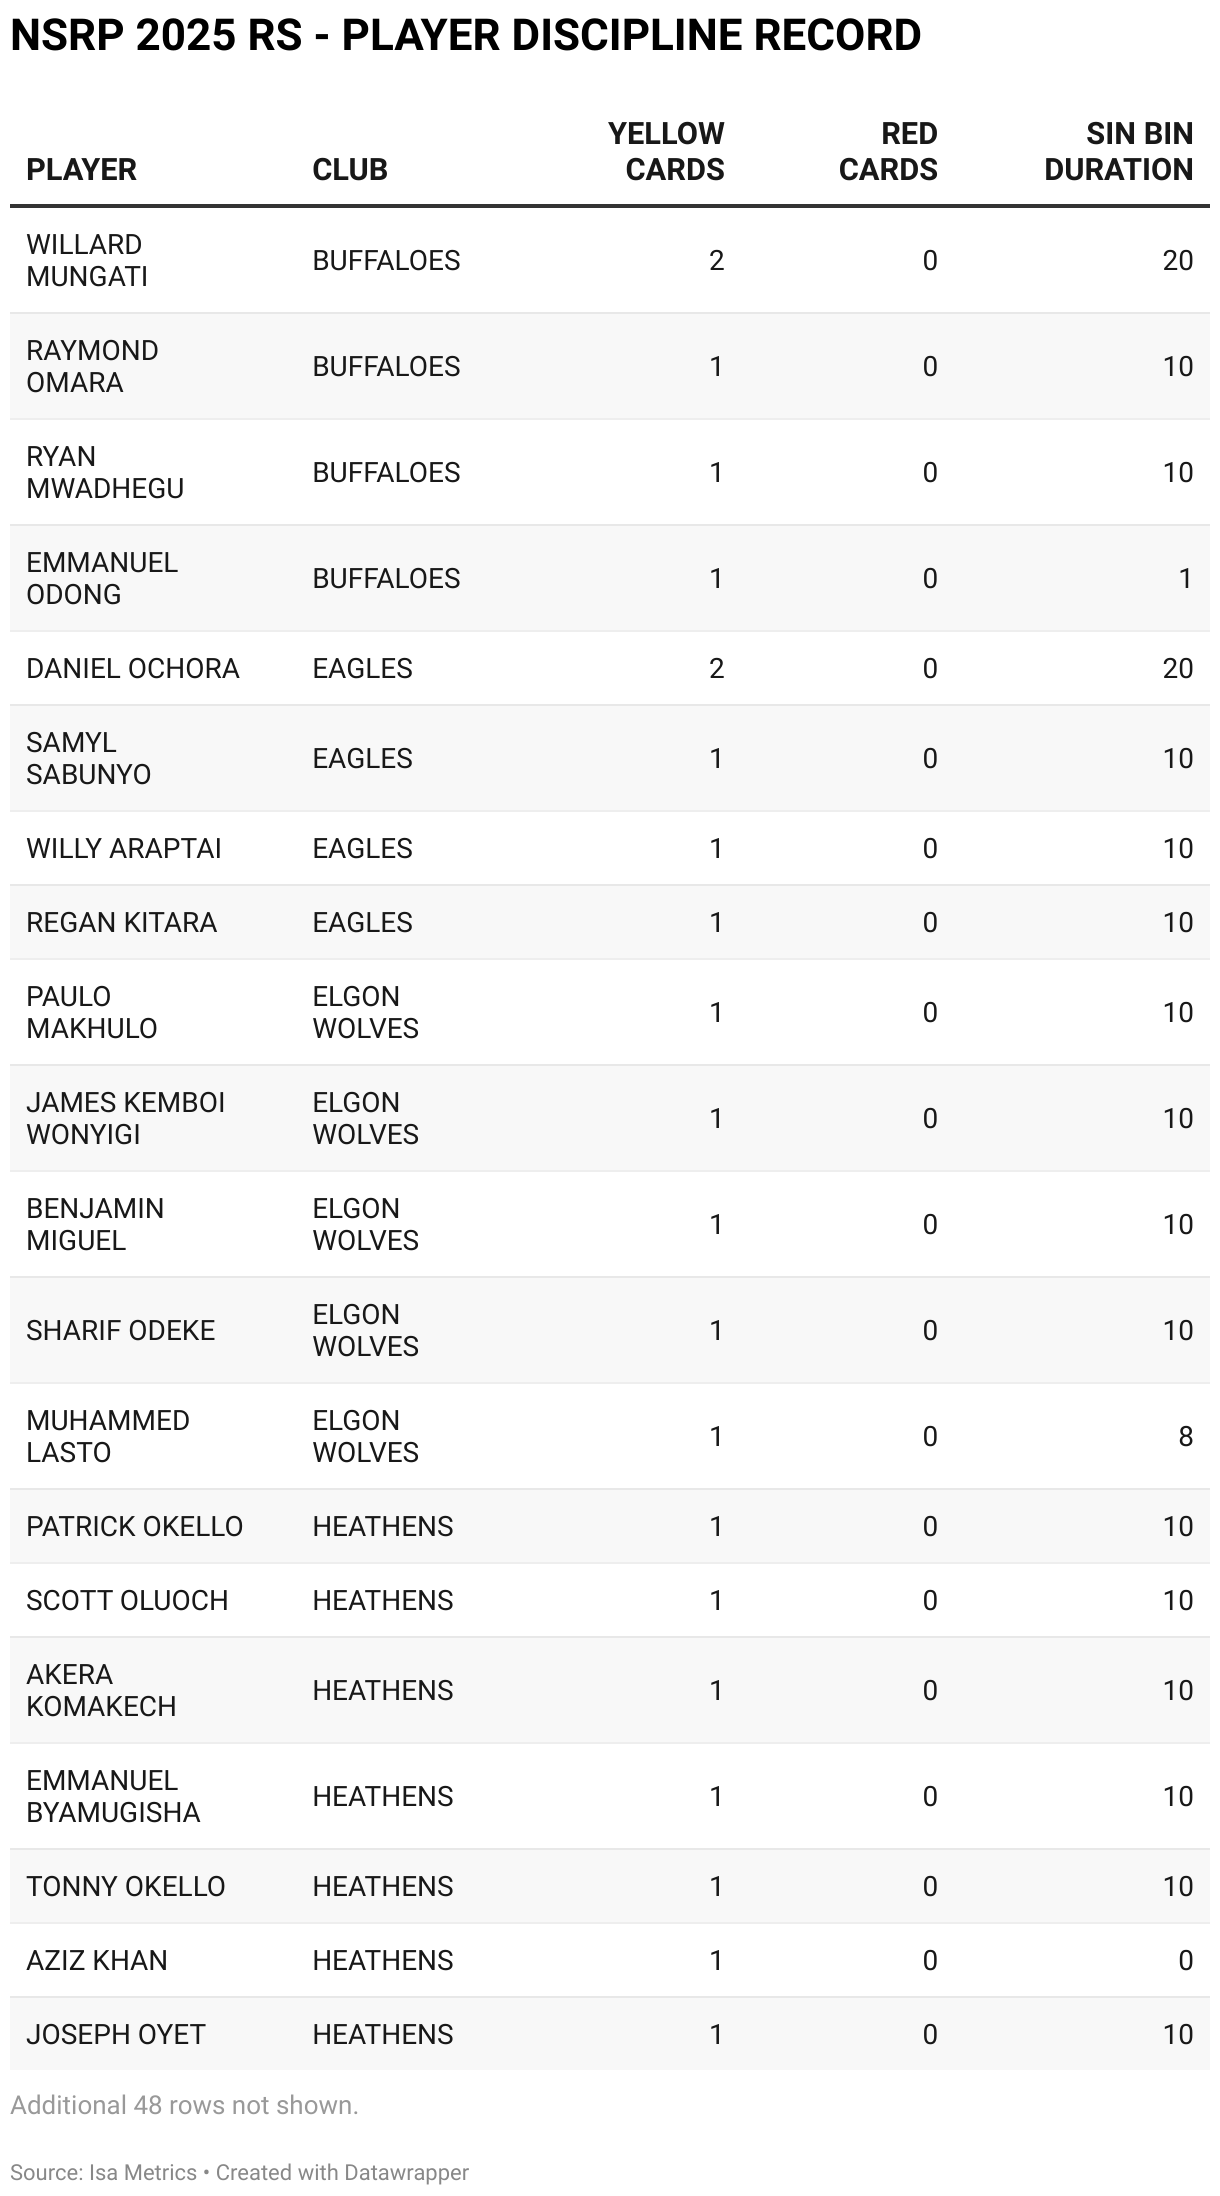
The player discipline record is arranged in the table below, according to club (alphabetical order) then the players who received red cards are listed first within each club, then followed by those with yellow cards in descending order.
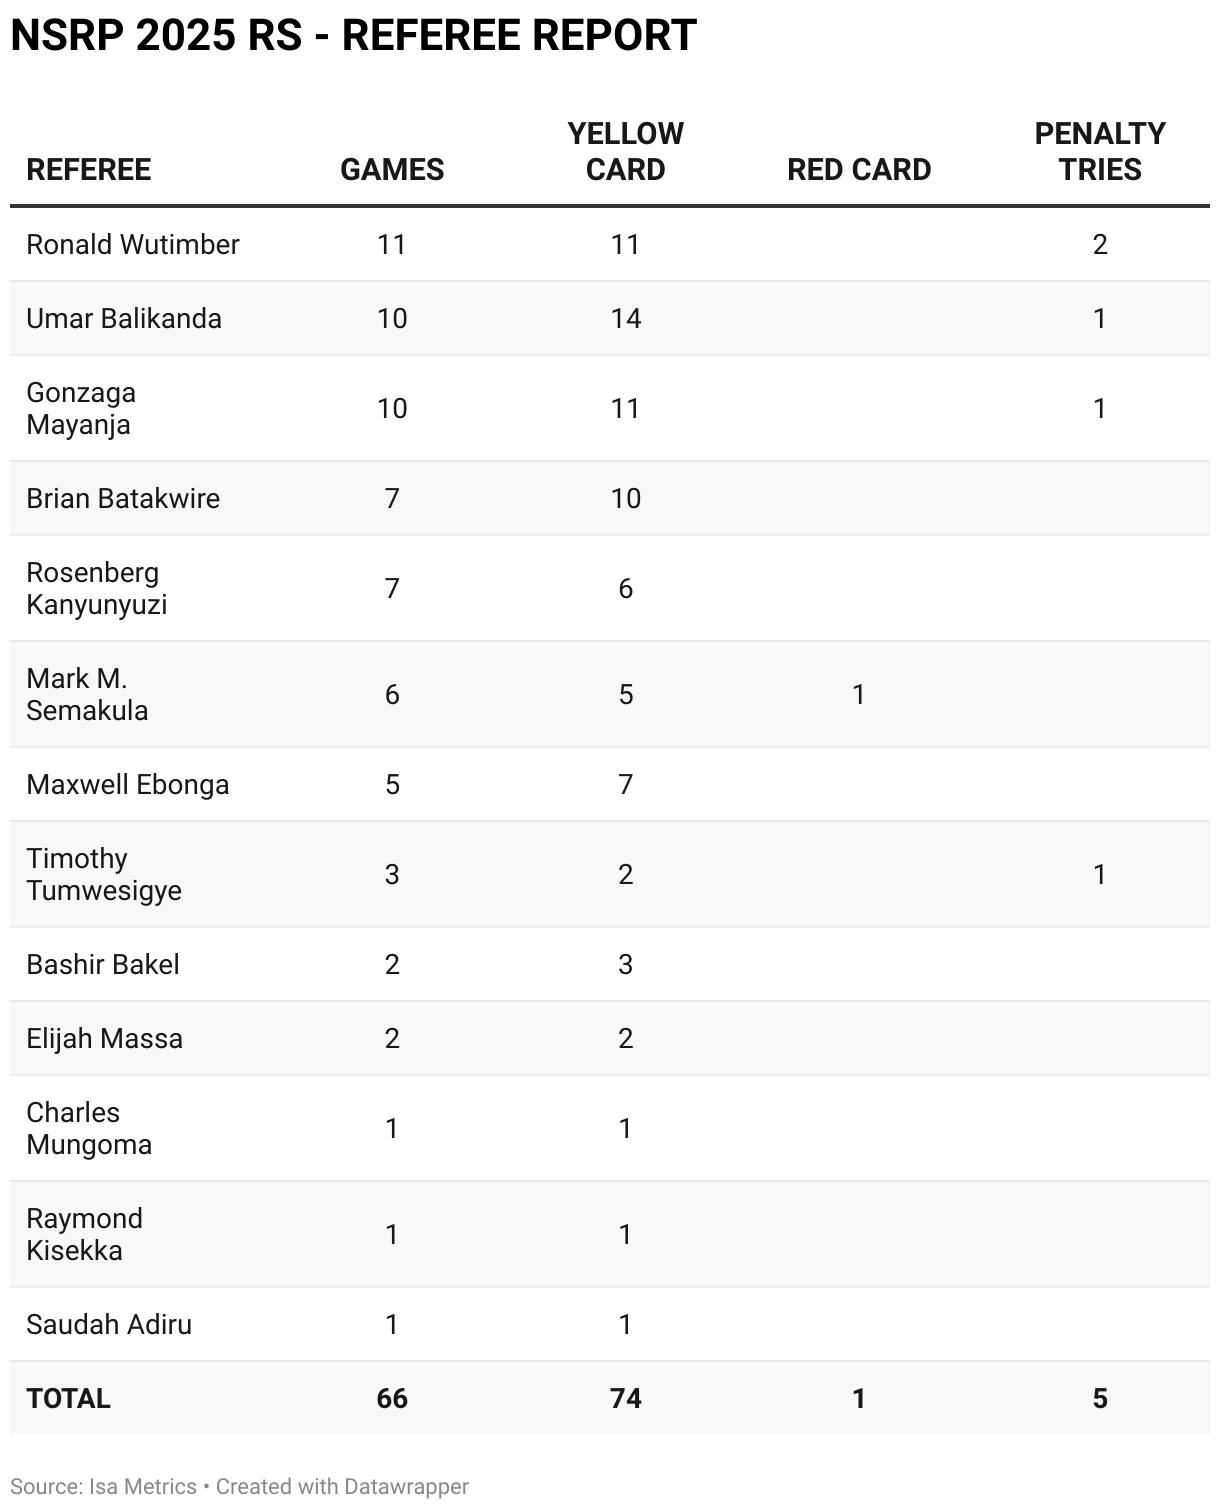
The final table on discipline lists the referees and the games officiated with the respective yellow cards, red cards and penalty tries issues.

Ceteris. Paribus.
Comments
Post a Comment